
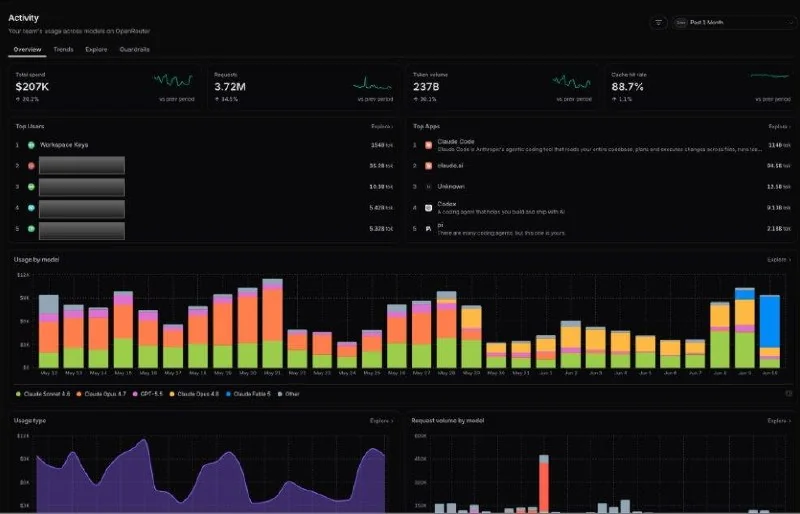
OpenRouter has launched a new Activity Explorer dashboard that gives developers and teams real-time visibility into multi-model API spending. The dashboard lets you monitor costs, token usage, and cache hit rates across different models, team members, and agents.
https://twitter.com/OpenRouter/status/2064730000956489889
The control panel is divided into several modules. The Overview shows model usage share, a comparison of bring-your-own-key (BYOK) spending versus platform credits, request volume distribution, token consumption breakdown, and prompt cache data. The Trends module tracks spending evolution over time and includes a hot list of top models. Data from last week shows that OpenRouter’s prompt cache hit rate reached 82.8%, with total cached tokens surpassing 8 billion. Among agent and client consumption, Claude Code (a terminal-based coding assistant) leads in usage, while Cursor is emerging as a fast-growing new entrant.
For enterprise and multi-member teams, the Explore module supports cross-filtering by model, provider, API key, request source, and country, with CSV or PDF export by hour, day, week, or month. The Guardrails module integrates execution log monitoring for prompt injection and personally identifiable information (PII) leakage blocking rules.